A whirlwind tour of growth versus limits
The problem is, exponential growth patterns don't give you an early warning sign.
Because the dangers really speed up at the end, when it's too late to do anything about it.
-- Dr. Kent Moors
Exponential Growth for Doomies:
Double, Double, Toil and Trouble
We all think we're familiar with growth.
If we can earn $1000 a week, that's $4000 a month and $48,000 a year. Nice, neat and linear. Most of what we count in our everyday lives is like that.
But exponential growth aka geometric growth aka non-linear growth isn't as intuitive. Even if one is familiar with it, this kind of growth can ambush us.
If something is growing exponentially, each dollop added to the heap is proportional to (a fraction of) the heap that's already there. The bigger the heap, the bigger the dollop, the bigger the heap the bigger the dollop... a dash, a pinch, a dollop, a handful, a bucket.....
We typically say the heap is growing at some percent rate per unit of time, say 5% annually (that is, 5% of the total heap size added to the heap every year... the amount added gets bigger each round).
Or we might say that it has such and such a doubling rate, or doubling time (the time it takes the heap to double in size), say every 14 years.
The Rule of 69 (or 70) allows a rough estimation of doubling time if we know the percent rate of growth per unit of time. Using 70 is more convenient than 69, but the math is easier.
Rule of 70 --> Doubling.Rate = 70 / (%Rate.of.Growth /Unit of Time)
[Divide 70 by percent rate per unit of time to yield the doubling rate in units of time.]
This looks worse than it is.
From the example above, If our percent rate of growth per unit of time is 5% per year, then 70/5 = 14, and so our heap will double in 14 years. If the rate of growth applied quarterly, say, it would double in 14 quarters.
Or, if an economy grows at 2.5% per year on average, then 70/2.5 = 30 years. That economy will double about every 30 years.
 |
| US GDP growth overlayed on yellow exponential curve |
Now, the thing is, at a low rate of exponential growth, things might look nearly flat for a long, long time (like my father before me, time out of mind; as if nothing will ever change). Then things pick up to an exciting time of change for the better (that old woman saw the first automobile AND the first moonshot). Things pick up more, and things get a little scary (That kid born in 2000 is now looking at super bugs, cyber warfare and an ice-free arctic).
Each doubling time... tick, tick, tick... doubles the entire heap.
The rate of change may stay the same, but the increment of change - the dollop of change - gets bigger. And bigger. And BIGGER! As we go from the more horizontal portion of an exponential curve to the more vertical portion, any given stretch of time - a year; a decade; a lifetime - spans an astonishing increase. Each stretch encompasses an ever more fantastic volume of change.
In rough terms, the global economy - the world's heap of goods, services and assets - has been doubling every 25 years for the last two hundred (give or take).This means today's global economy is roughly 256 times that of 1800. Double the economy of 1990.
At every doubling, close to twice the resources are consumed. Twice the waste produced. Twice the 'footprint' is required, as it were. The next doubling is due about 20 years from today according to the IMF.
A 'next doubling' assumes nothing happens big enough to derail that juggernaut. It has mass. It has momentum. If it hits a wall or leaves the tracks it'll make one hell of a wreck.
My friends, we live in a time when the now vast human world is doubling every few decades.
Kurzweilians foresee the Singularity (when the technological curve goes vertical in) about 2045. If we make it that far, all bets are off.
We Doomies think that, coming somewhere soon-ish along the economic curve, something's gotta give. We'll hit the limits our planet can support. And then the trend will break. Break bad.
How many more doublings have we got?
PS. Ugo Bardi recently posted this clever discussion of and mnemonic taxonomy of exponential growth (and decay) curves.
This comment has been removed by the author.
ReplyDeleteI have seen the explanation in regards to doubling in a finite space, such as a pond being covered by lily pads or a petri dish covered by bacteria. The biggest thing I got from that was with only two doublings left, the surface was still 75% open, and one doubling left it was still 50% open.
ReplyDeleteHi Dennis,
DeleteYes... the 'classic' lily pad riddle is; given that the lily pads in a pond double each day and that in 30 days the pond will be completely covered, on which day will the pond be half covered. Answer: day 29.
And on day 28, one quarter will be covered. And on day 27, one eighth. Day 26, 1/16th and so on.
The point is, a long, slow start with little apparent change, then phenomenal change. Just before the end, it still looks as though there's plenty of room. After all, it took 29 days to fill up half the pond, and we still have a whole half left, right?
In our case, we've spent approximately 10,000 years filling our pond roughly halfway (some would say more). The 'elbow' of the curve (transition from little change to phenomenal change) came during the 20th century, and the increment of change is mind-bogglingly huge (spell-checker doesn't like that!). The vertical portion of an exponential growth curve is unsustainable.
We know the economy will double in about 20 years (at the IMF's current estimated growth rate of 3.4%). We will shortly see if half a pond remains!
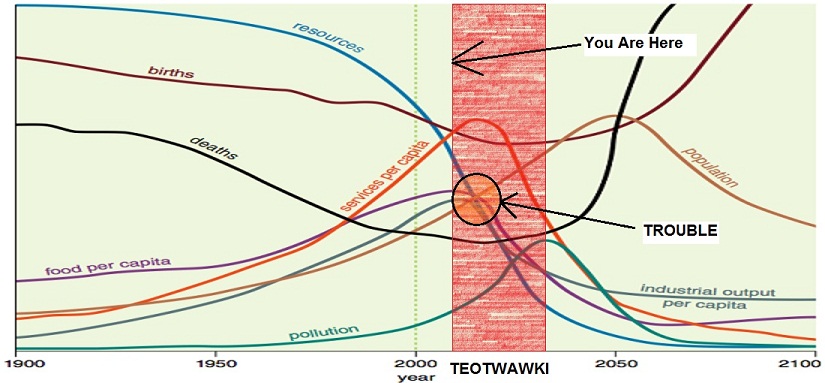
One way or another, the end of growth is almost upon us. Business as usual is about to change radically, voluntarily or not.
TEOTWAWKI, either way.
Dave Z
BTW, the growth rate in that riddle, using the Rule of 70 backwards, is:
Delete70 / 30 days ==> 2.33% per day
DZ